Using Evaluations and Comparisons to Make Awesome DL Models
Think your DL model is awesome? Think again. In this blog, we'll review some metrics to evaluate your model to uncover whether it's actually solving your problem.

Think your DL model is awesome? Think again.
It's not enough to just create a working model. You must also understand your model’s predictive performance and determine if it's improving as you iterate on it. The ultimate question to answer is:
Does my model actually solve my problem?
This blog will review several metrics to evaluate your model and why metrics are important to answering that ultimate question.
Accuracy
Accuracy is a common metric representing the percentage of correct predictions. Accuracy is calculated as:
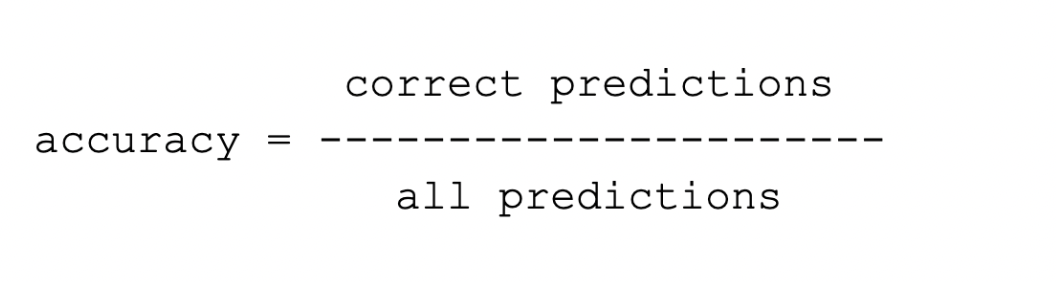
You’d think that accuracy is the be-all, end-all metric by its name. Accuracy is generally good for classification models trained on balanced datasets. However, it can fall apart for imbalanced classifications.
For example, a dataset for detecting rare diseases might contain very few data samples containing the disease, so it's possible that a model trained on this dataset learns to classify most real-world samples as non-disease. Thus it's important to recognize when accuracy is not the best metric to rely on.
True/False Positives and Negatives
Here is where true/false positives and negatives may be better performance indicators, as they cover more possible classification outcomes. True/false positives and negatives are expressed as:
- True Positive: an observation is predicted to belong to a class and actually does belong to that class.
- True Negative: an observation is predicted as not belonging to a class and actually does not belong to that class.
- False Positive: an observation is predicted to belong to a class but actually does not belong to that class.
- False Negative: an observation is predicted to not belong to a class when it actually does belong to that class.
These metrics are typically visualized in a Confusion Matrix that compares predictions to ground truth. After training your model in PerceptiLabs, you can generate a Confusion Matrix on the Evaluate screen. Figure 1 below shows a Confusion Matrix for actual versus predicted labels for the MNIST dataset of hand-written digits:
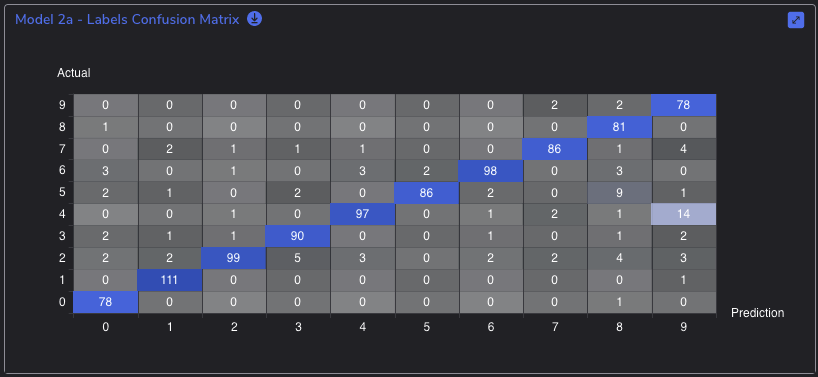
Understanding these results is important when you have imbalanced classifications. In the diseases dataset mentioned above, accurately diagnosing a medical image could mean the difference between life and death.
Precision and Recall
Building on true/false positives and negatives are Precision and Recall metrics.
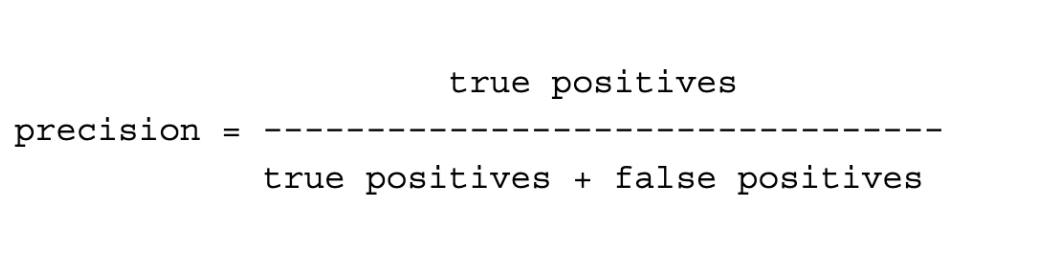
Precision (aka positive predictive value) is the proportion of true positives that were correct. Precision is calculated as:
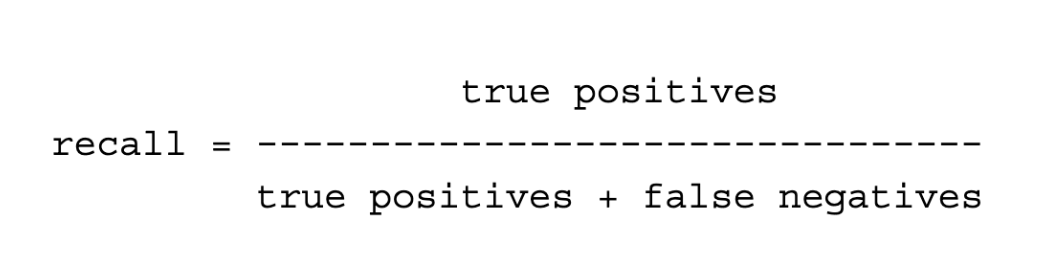
Recall (aka sensitivity) is the proportion of actual positives that were correctly classified by the model. Recall is calculated as:
These metrics are also useful for the rare disease example above. Precision can help ensure you're not overlooking cases with the disease, while Recall can help ensure you don't misclassify cases as having the disease when they don't.
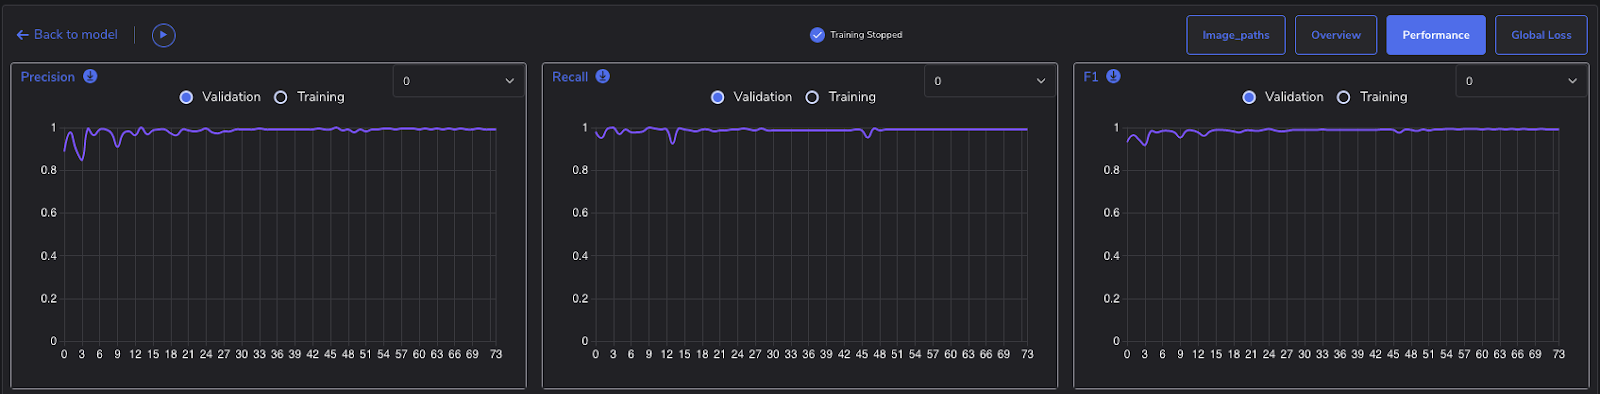
As with the Confusion Matrix, PerceptiLabs can calculate these for you on the Evaluate screen after you train your model. You can also see their values in real time on the Performance tab in PerceptiLabs' Training view, as shown in Figure 2 below:
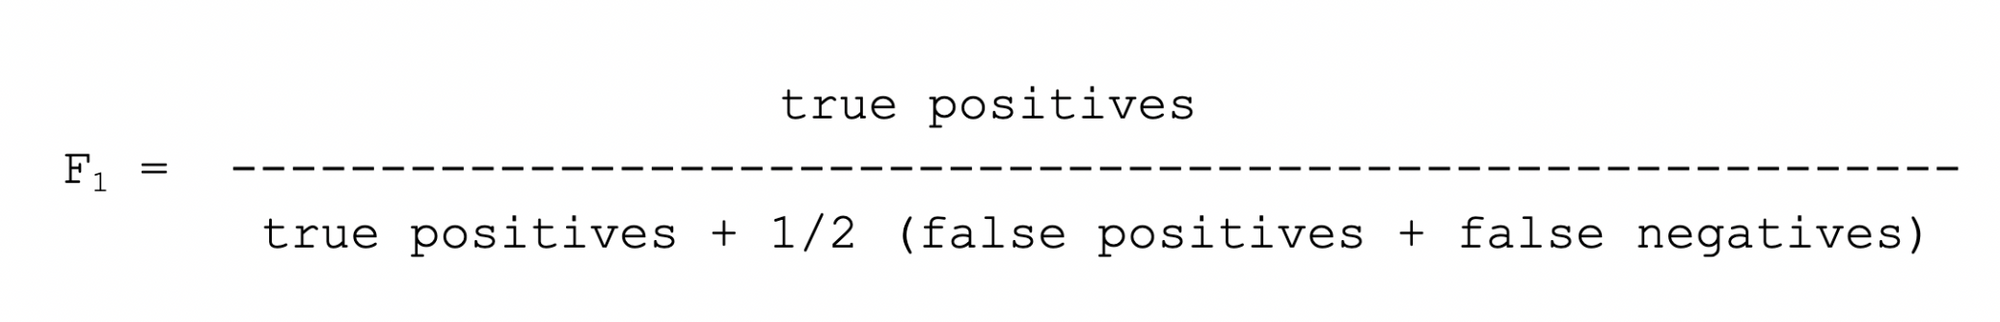
F1 Score
The F1 Score (aka F-score or F-measure) measures accuracy via the harmonic mean of Precision and Recall. F1 Score is calculated as1:
An F1 Score can be more useful than Accuracy when seeking a balance between Precision and Recall for imbalanced classifications with many true negatives. It's essentially just a quick summary of the performance of the model (based on the Precision and Recall) similar to how Accuracy also is a quick summary of performance.
An F1 score can therefore be used in the same ways as Accuracy can, to quickly gauge how well a model performed and to compare different models with each other. Normally, you would first look at Accuracy, Loss, F1 score as the overview metrics and then dig into deeper metrics such as Precision, Recall, Confusion matrix, and AUC graphs.
PerceptiLabs displays the F1 Score in the Performance tab of the Training view during training.
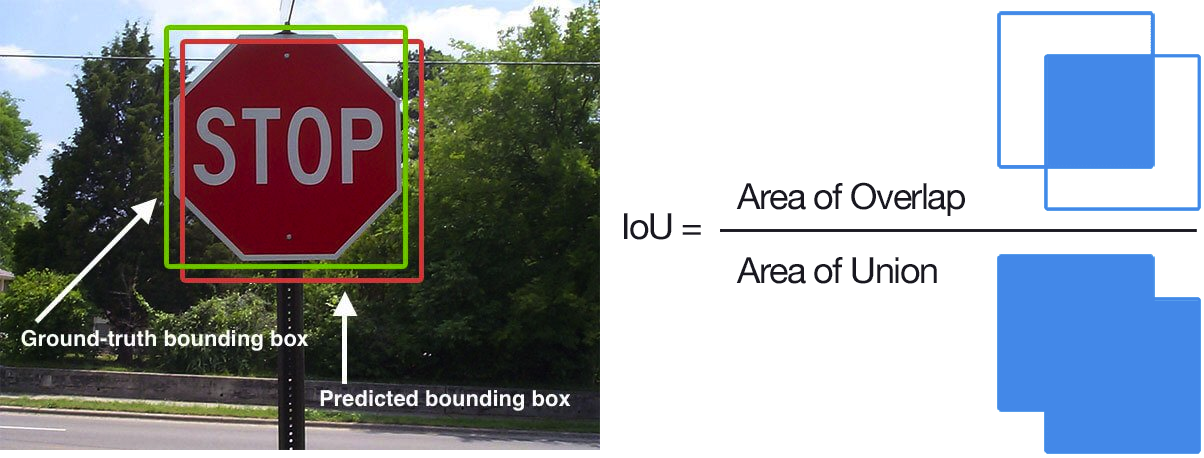
Intersection Over Union
Intersection Over Union (IoU) is important for computer vision problems. For example, IoU can compare how accurately a model calculates an object's bounding box, versus the ground truth bounding box. Since the two are unlikely to match exactly, IoU calculates their overlap (intersection) compared to their combined area (union). The following images from this excellent article provide a great illustration of this:
Understanding IoU is important to ensure your model detects objects correctly; it could even impact safety in applications like autonomous driving powered by computer vision.
Some Final Advice:
1) Compare: Always create and train multiple models on the dataset for comparison. This is important so you can experiment with different settings and ensure your efforts are improving the model. We recommend using the same software package each time and keeping detailed records of the changes and results. Currently, you can achieve this in PerceptiLabs by giving your models descriptive names, and then adding non-connected Custom Components to store notes via code comments as described in this forum posting. In the near future, PerceptiLabs will add support for model version control, and the ability to store notes along with your models.
PerceptiLabs' Overview screen allows you to create multiple models for the same dataset easily, and PerceptiLabs can even train several models in parallel.
2) Split: Be sure to split your dataset into training, testing, and verification partitions. PerceptiLabs' Data Wizard defaults to a 70/20/10 split which you can generally leave as is. Splitting is important because it enables the model's fit to be tested during training, and for verification of the model's potential real-world performance.
3) Sandbox Testing: Deploy the model to a sandbox environment first and test using real-world data. It is important to see how the model handles inference in the real world, especially during testing. Then, record the results and continually improve the model. We recommend trying out PerceptiLabs' Gradio deployment which allows you to easily deploy and try out different data samples on your models.
4) Post-deployment Testing: Similarly, continuously perform testing after deploying the model to a production environment. These iterations are important for identifying and avoiding model decay and may facilitate a formal MLOps plan.
5) Ask the Ultimate Question: Continue to ask if the model is solving your problem. There could be ramifications ranging from social to safety implications.
Make Your DL Model Awesome Today!
If you don't already have PerceptiLabs, follow our Quickstart Guide to run the free version. Then, check out our Basic Image Recognition and Basic Image Segmentation tutorials, where you can put some of the advice from this blog into practice before building your own awesome DL models.
1See https://en.wikipedia.org/wiki/F-score for the derivation of this formula.