Use Case: Classifying Fruit
The handling of perishable foods like fruits and vegetables in a supply chain can involve many processes. Traditionally, these processes were done by hand, but we built an image recognition model in PerceptiLabs, to see if it could identify different types of fruits simply by analyzing images.
The handling of perishable foods like fruits and vegetables in a supply chain can involve many processes like sorting, weighing, and identifying expired produce. Traditionally, these processes were done by hand, but are becoming more automated as technology advances. And now that areas like Industrial IoT (IIoT) and ML are increasingly playing a role in supply chains, industry players can utilize technologies like image recognition to help classify products, make decisions at the edge, and optimize their operations.
Verticals like this represent a good test for ML. Take for example, foods like fruits and vegetables. Each specimen can vary in size, shape, and features, while environmental factors like lighting all add complexities to training data for image processing.
Thankfully here at PerceptiLabs, we never back down from a challenge. So we built an image recognition model in PerceptiLabs, to see if it could identify different types of fruits simply by analyzing images.
With a sufficiently high level of accuracy, a model like this could potentially help farmers, wholesalers, and supermarkets to automate different processes of the supply chain responsible for managing and handling these products. Let's see how we made out.
Dataset
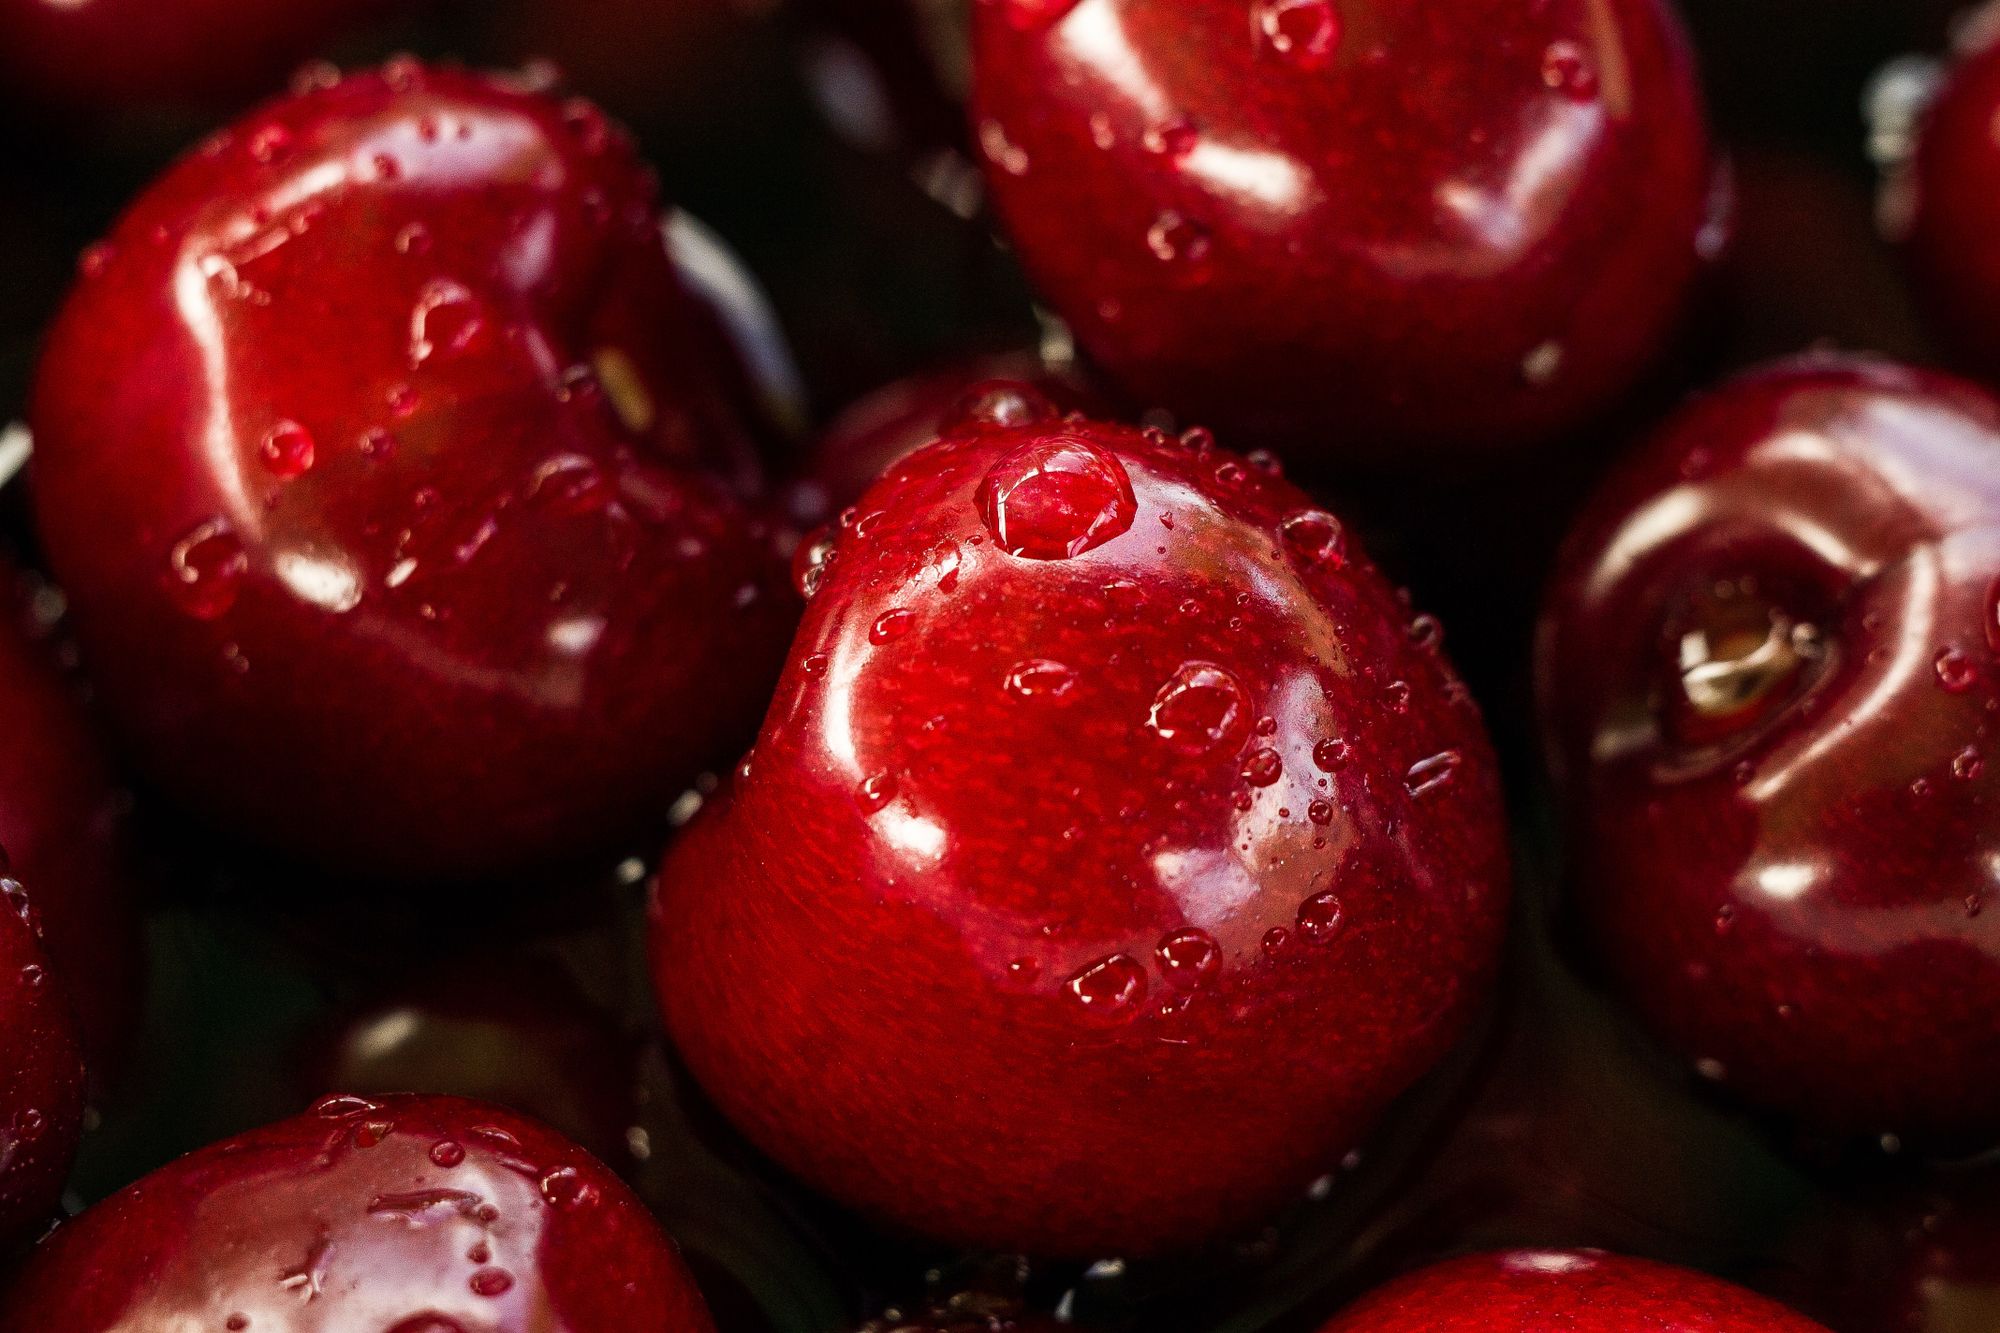
To train our model, we used the images from the Fruits 360 dataset on Kaggle which were originally acquired using video capture as shown here.
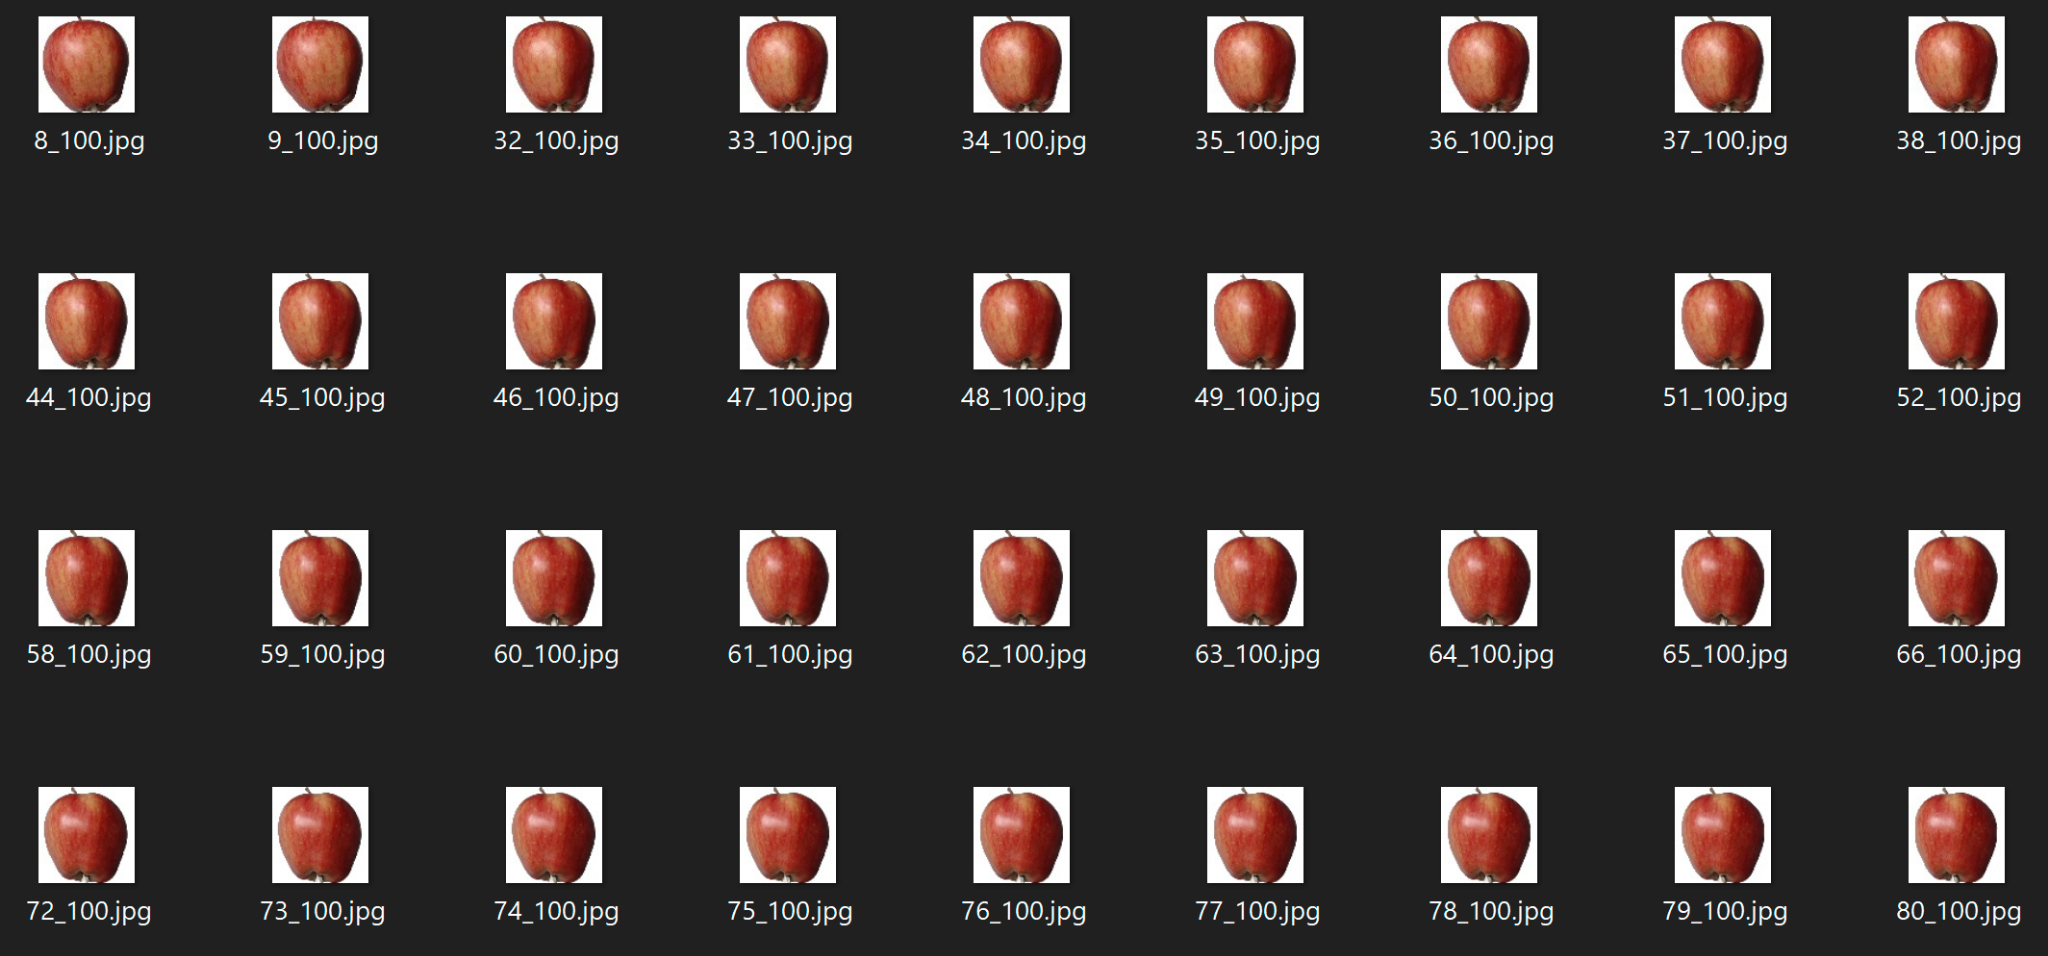
The dataset comprises over 90,000 color .jpg images divided into 131 classes representing different types of fruits. Using a subset of just over 6500 images, we resized each to 224x224 pixels using the pre-processing options in PerceptiLabs' Data Wizard. Figure 1 shows some example images of apples from this dataset:
To map the classifications to the images, we created a .csv file that associates each image file with the appropriate fruit classification label to load the data via PerceptiLabs' Data Wizard. Below is a partial example of how the .csv file looks:
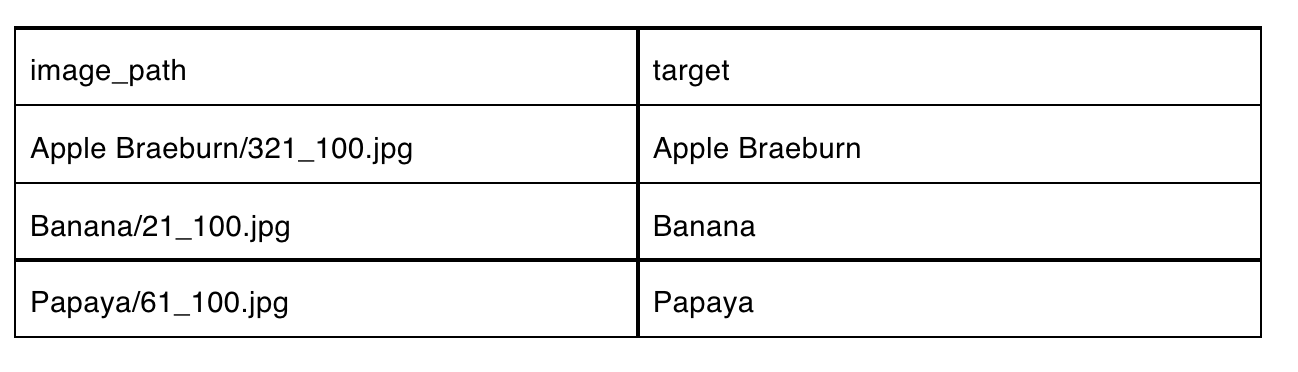
Example of the .csv file to load data into PerceptiLabs that maps the image files to their associated labels.
We've made the image data and this CSV file available for experimentation on GitHub.
Model Summary
Our model was built with just one Component:
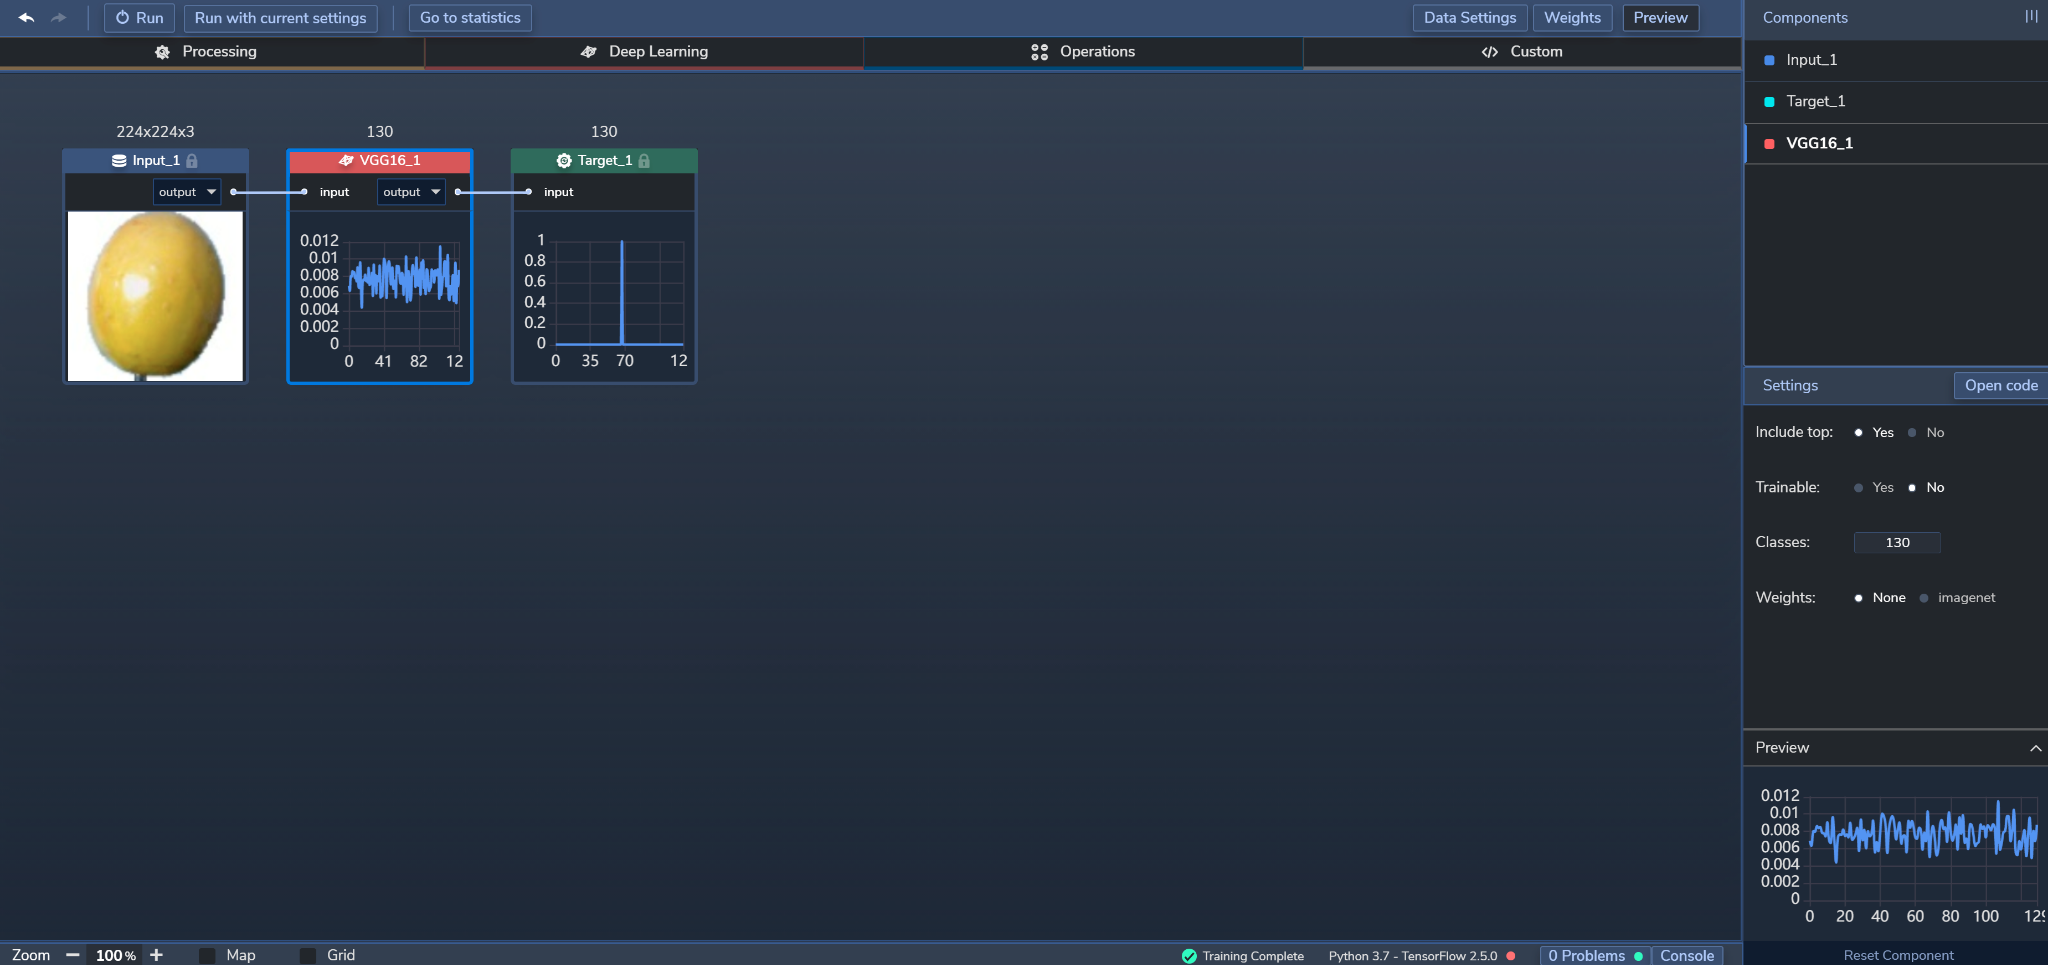
The VGG16 model we employed is a neural network architecture with 16 layers where 13 of them are convolution layers and the remaining three are dense layers. Figure 2 shows the model's topology in PerceptiLabs:
Training and Results
We trained the model with 5 epochs in batches of 32, using the ADAM optimizer, a learning rate of 0.001, and a Cross Entropy loss function. With a training time of around 74 minutes and 44 seconds, we were able to achieve a training Accuracy of 99.82%, validation accuracy of 99.54%, and a test accuracy of 99.6%. Global Training Loss was 0.19% and Global Validation Loss was 0.14%.
Figure 3 shows PerceptiLabs' Statistics view during training:
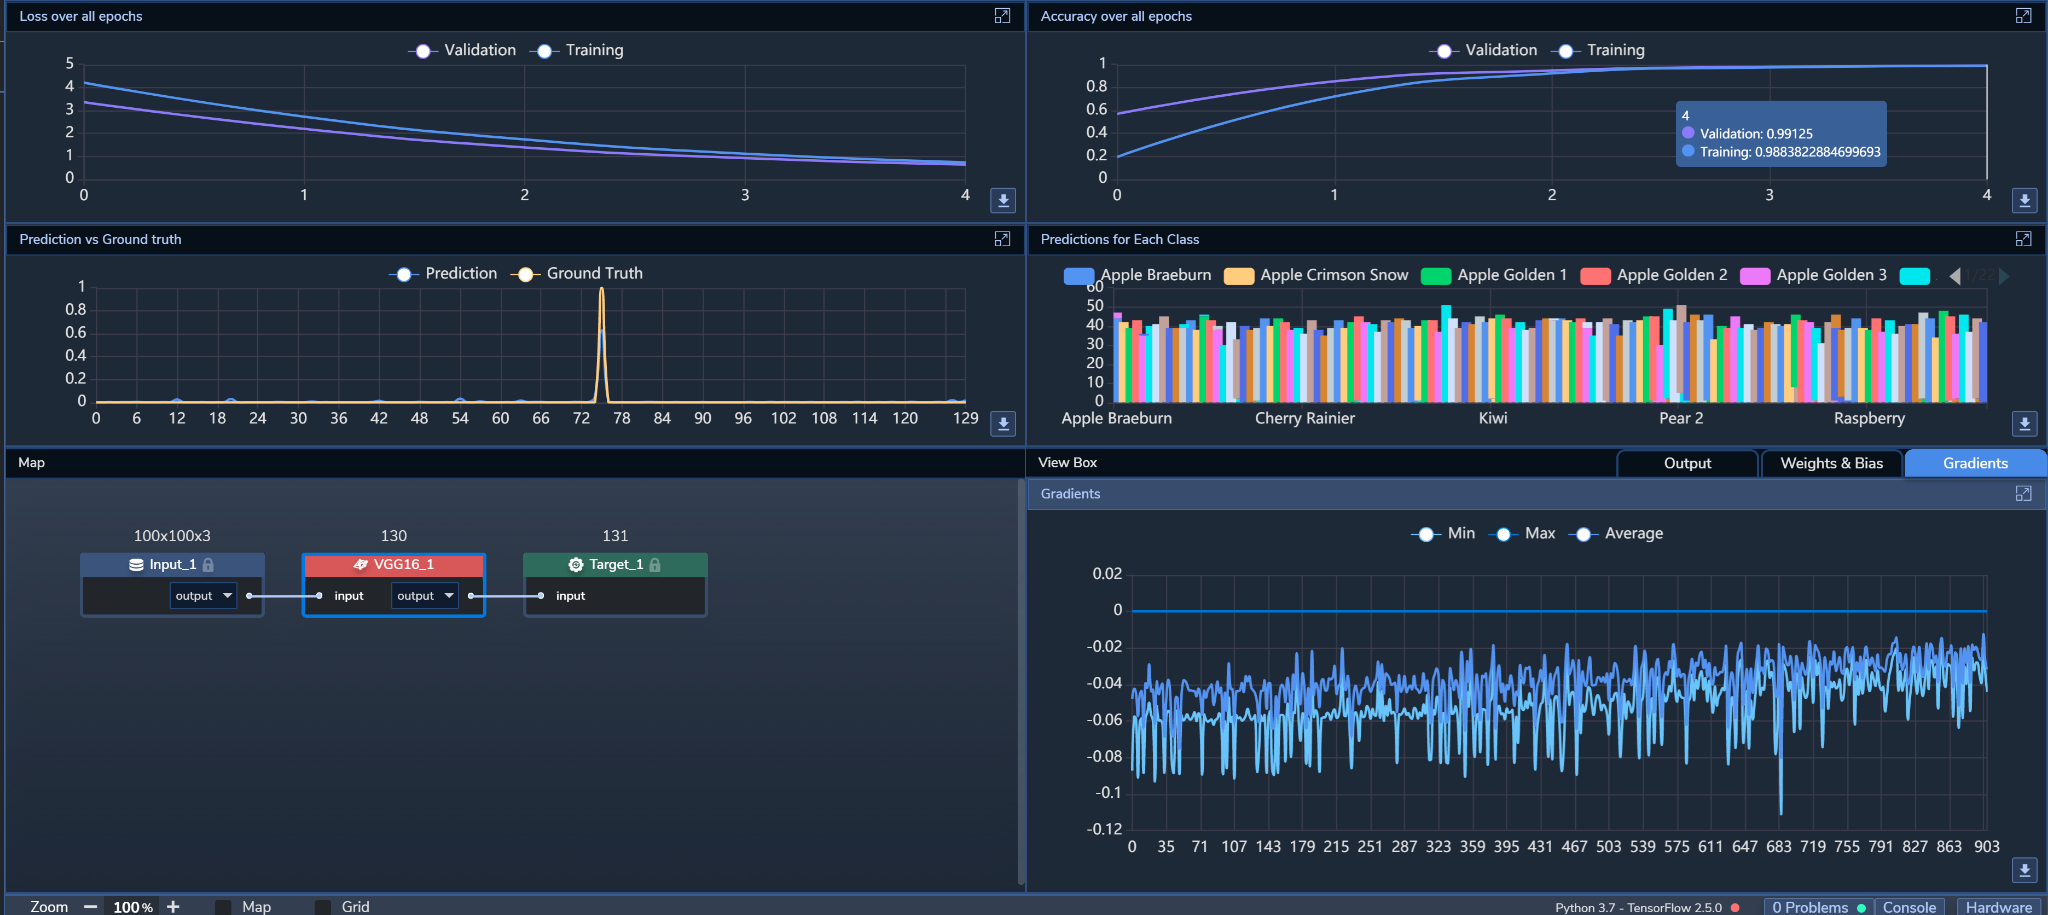
Here we can see that the validation and training losses gradually dropped over the epochs and both had very similar curves. The curves for both validation and training accuracy also mirrored each other's shapes and ramped up over the first three epochs before stabilizing at just under 1.0.
Figure 4 shows the Classification Label Metrics Table test results and confusion matrix for the model:
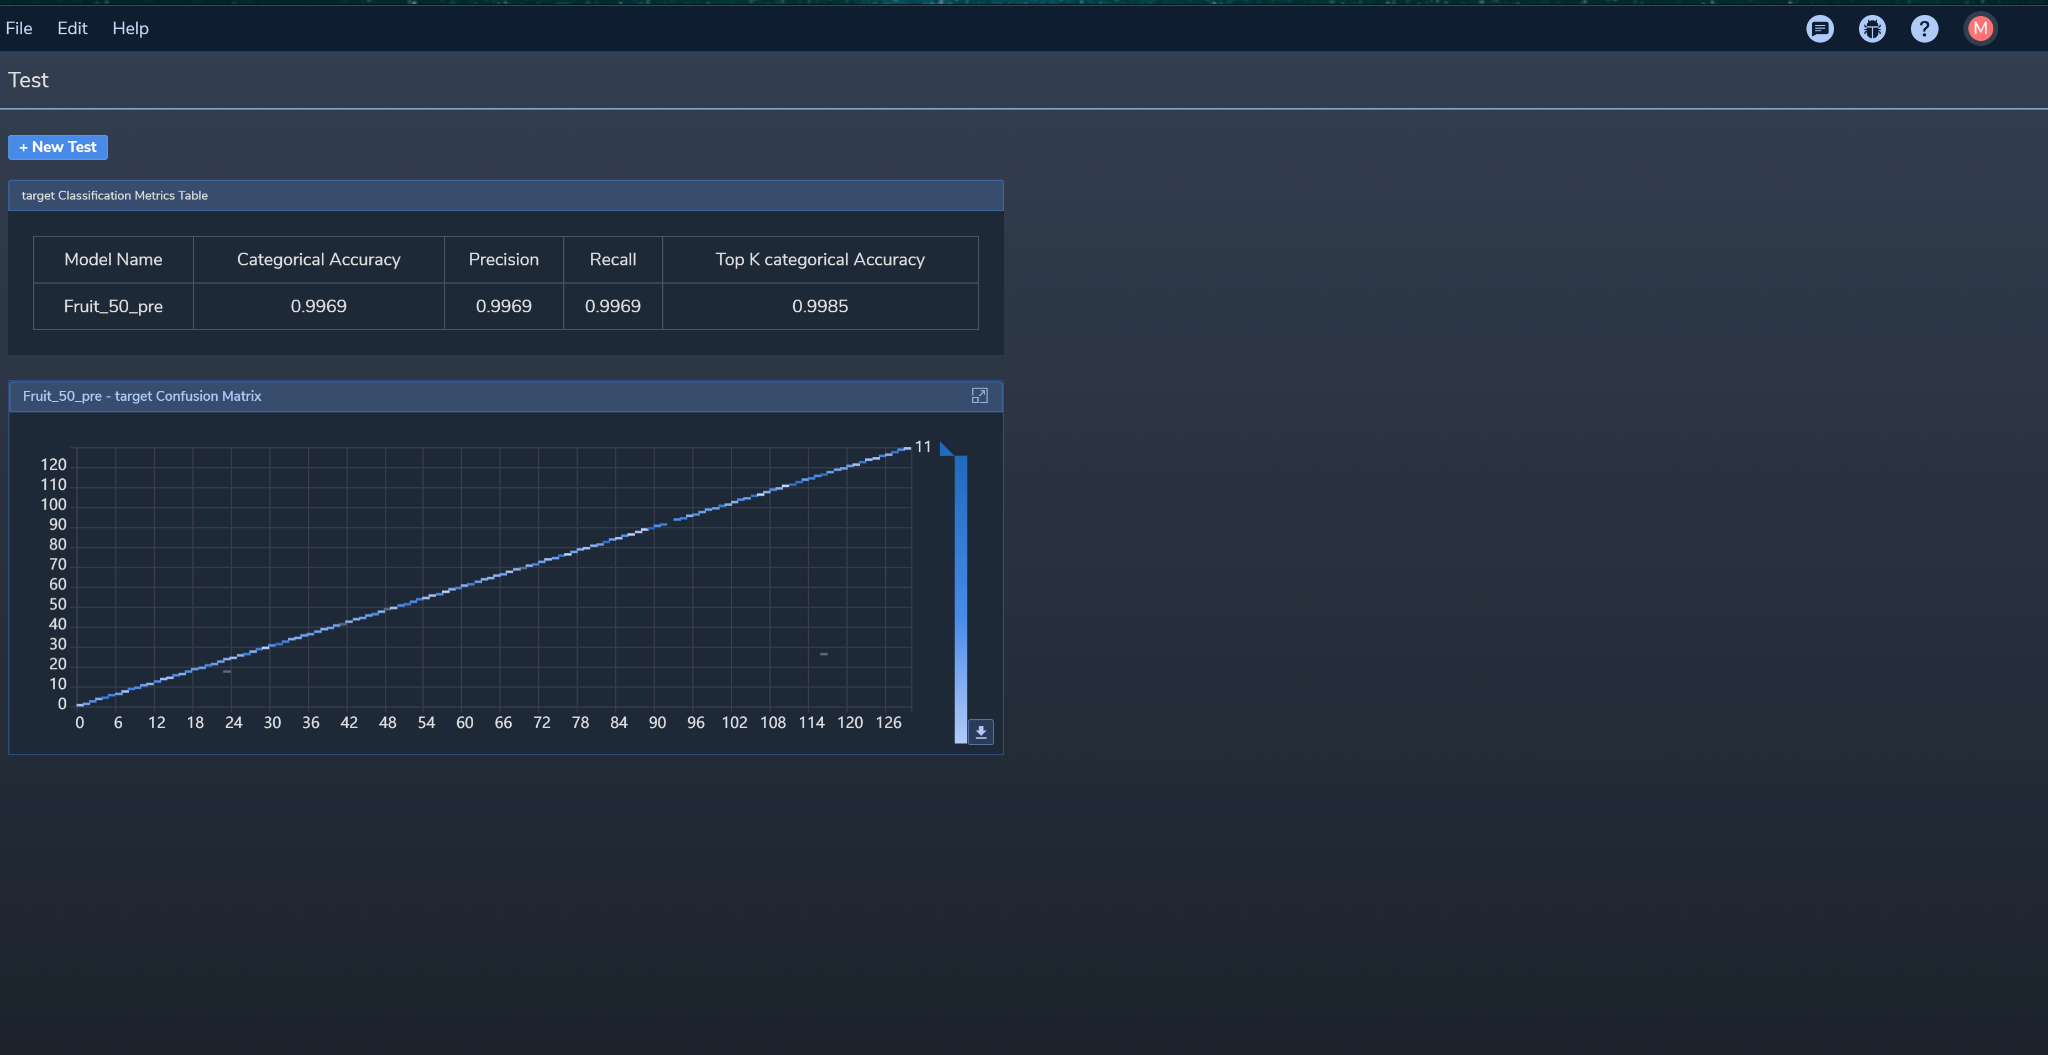
The Confusion Matrix shows that the model tests almost all of the samples correctly (i.e., there are only a few false positives or negatives). The Labels Metrics Table corroborates this by showing high (normalized) values for the following: Categorical accuracy (accuracy for each category averaged over all of them), Top K Categorical Accuracy (frequency of the correct category among the top K predicted categories), Precision (accuracy of positive predictions), and Recall (percentage of positives found (i.e., not misclassified as negatives instead of positives).
Vertical Applications
A model like this could be used during the collection, sorting, and distribution of fruit. For example, the model could be used to analyze photos or video frames acquired through cameras for analyzing different species of apples on a conveyor belt to help sort them. The model itself could also be used as the basis for transfer learning to create models for classifying other types of foods, materials, or products.
Summary
This use case is an example of how an image recognition model could be built to support supply chain processes which incorporate IIoT and/or ML. If you want to build a deep learning model similar to this, run PerceptiLabs and grab a copy of our pre-processed dataset from GitHub.